
Global Marketing Analytics Lead
Noah GomaaClarity beyondthe numbers.
I bring marketing analytics, data science and data engineering together to understand real, sustainable growth.
Explore my workGlobal Marketing Analytics Lead
I bring marketing analytics, data science and data engineering together to understand real, sustainable growth.
Explore my workThe whole relationship
I look at acquisition, retention and customer lifetime value together. The quality of growth matters as much as its size.
Acquisition Retention Value
A useful starting point
I validate definitions, separate facts from hypotheses and reconcile numbers across systems before drawing a conclusion.
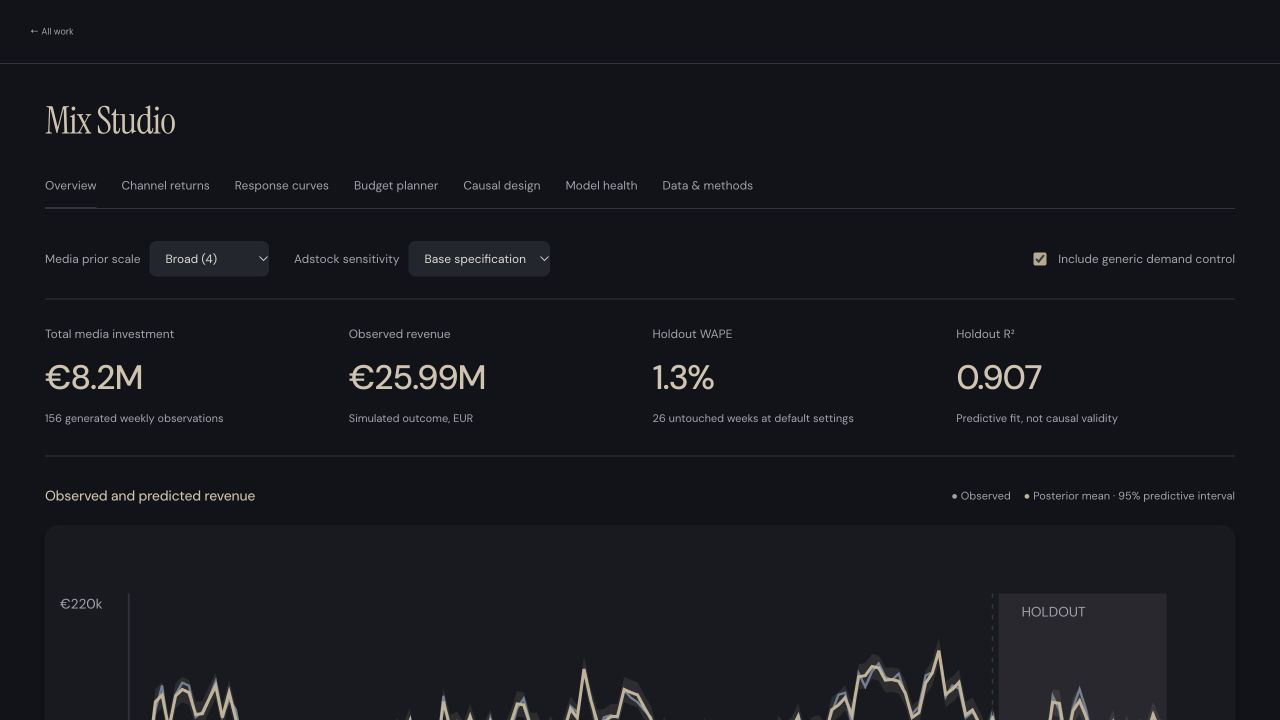
See the workWhat is the media mix really telling us?
I connected media returns, model checks and budget scenarios.
Follow the relationship between investment, response and uncertainty.
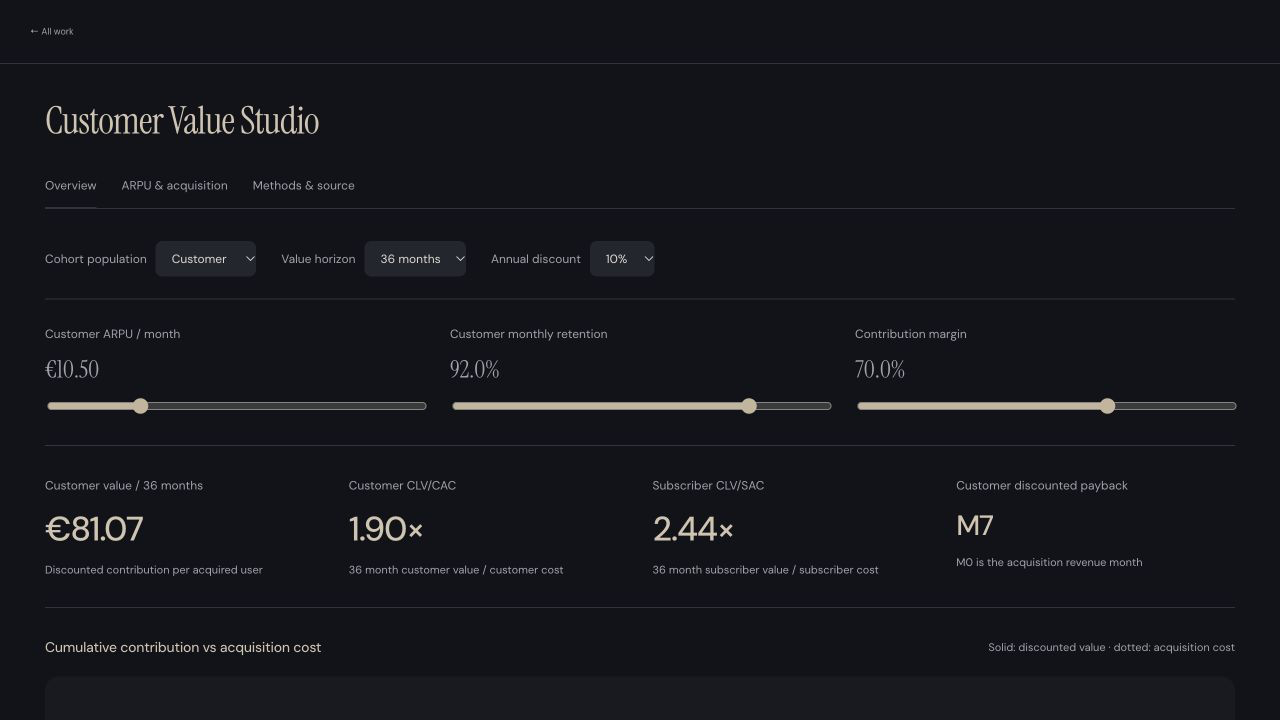
Is acquisition creating lasting value?
I connected acquisition costs with retention, value and payback.
Look beyond the first conversion to the economics of the full relationship.
How does a journey become channel credit?
I made channel credit traceable to the customer journey.
Trace the path before deciding how to share the credit.

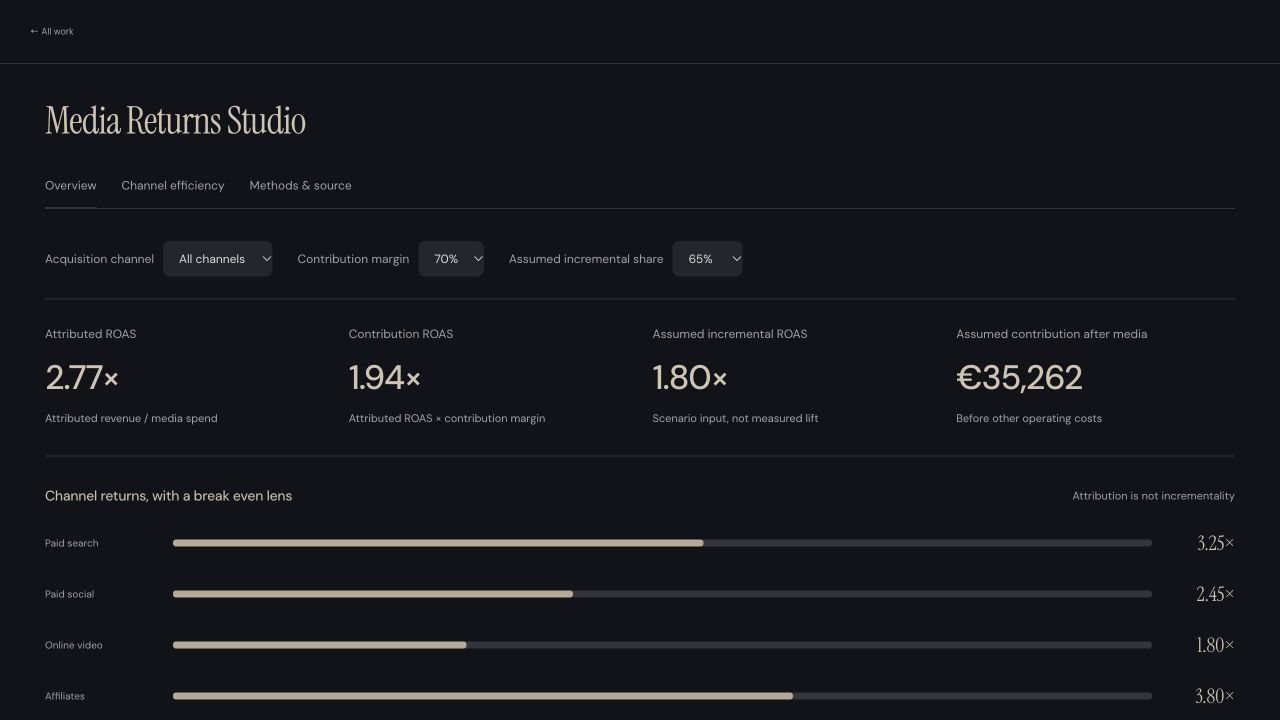
What sits behind the headline return?
I put media return alongside margin and acquisition cost.
Bring cost, margin and assumptions into the same conversation.
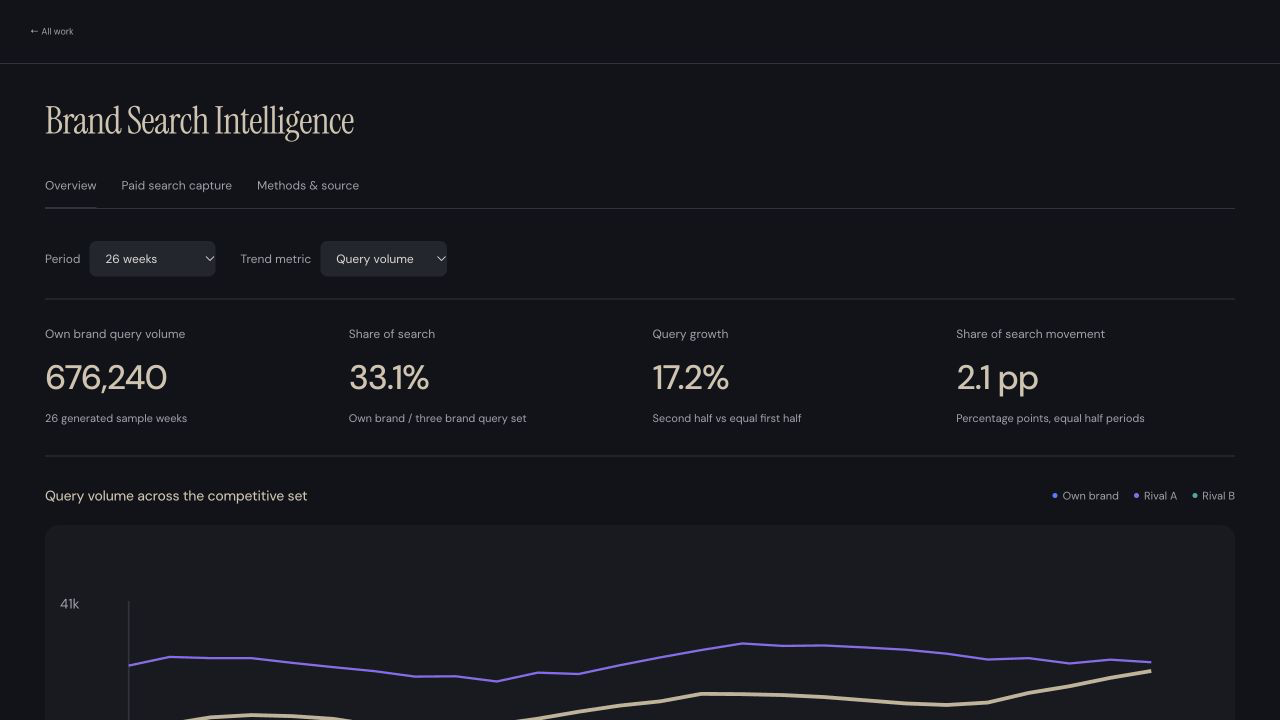
Where does demand meet paid capture?
I separated brand demand trends from paid search capture.
Separate the demand for a brand from the way paid search captures it.
What can a race reveal, lap by lap?
I built race analysis from season context to recorded replay.
Move from the season picture into the detail of a single session.
Open live project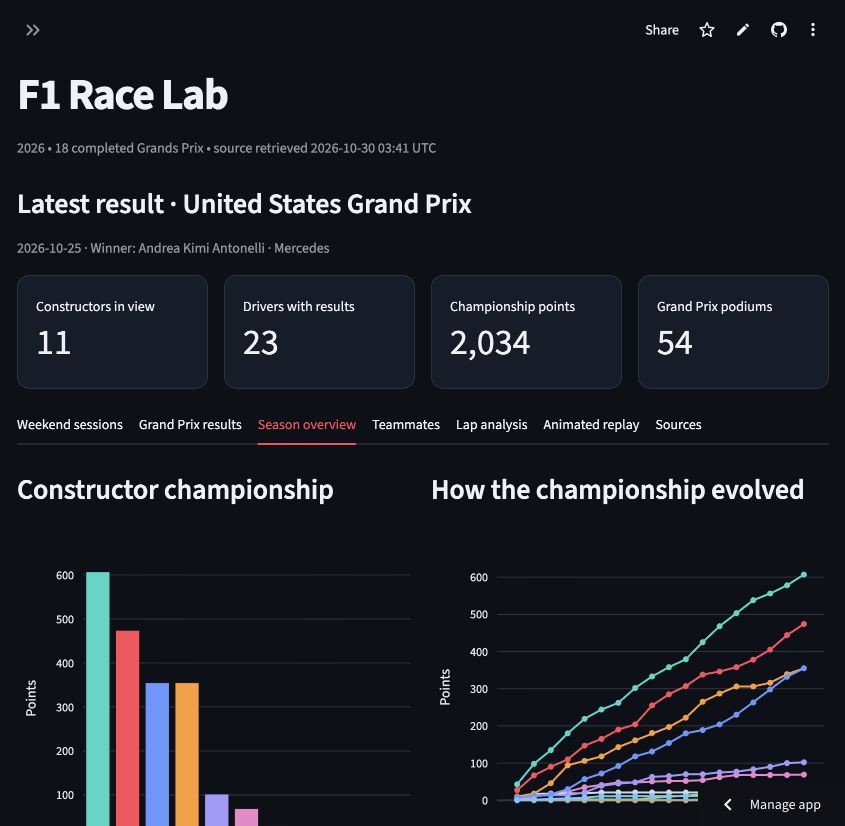
How does the world read?
I turned public reading research into an explorable data product.
Explore public research while keeping sources and missing evidence visible.
Open live project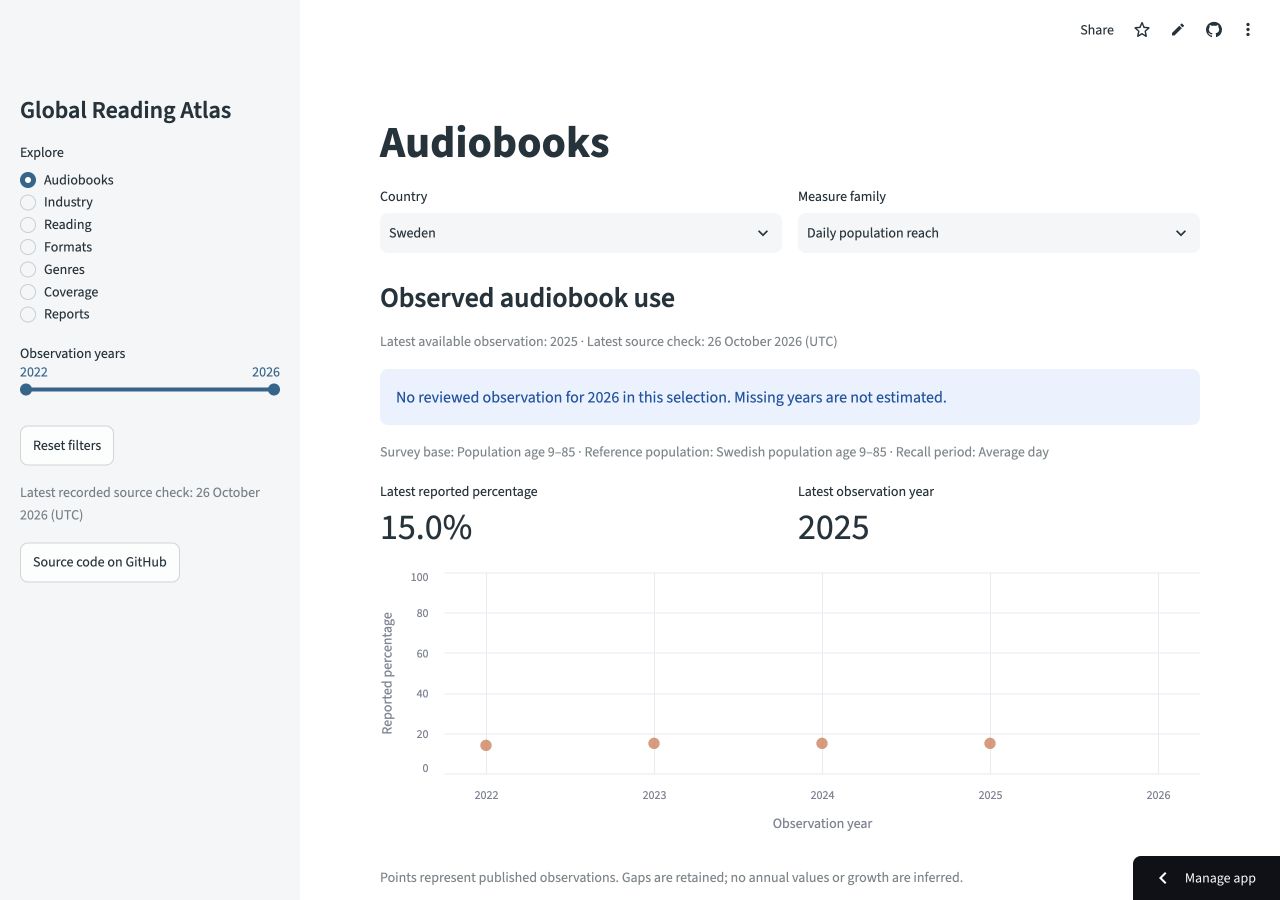
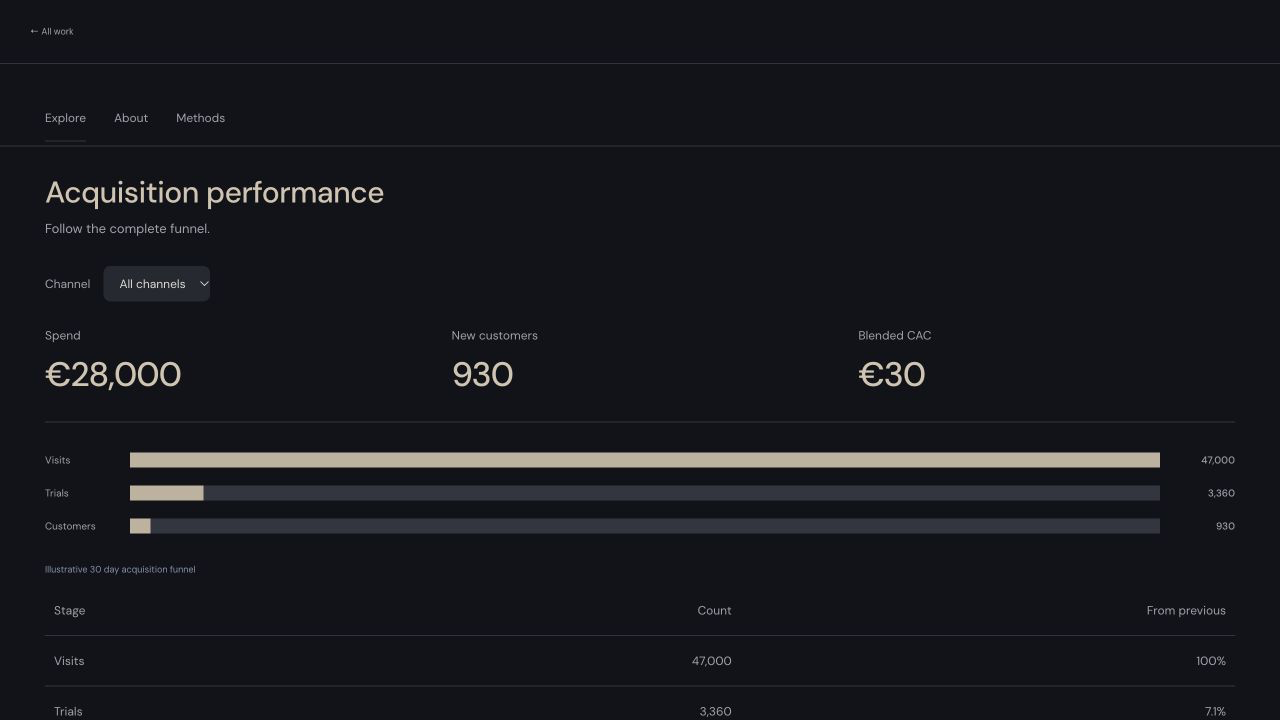
What happens between spend and signup?
I connected media spend to the complete acquisition funnel.
Follow the full funnel rather than stopping at the first click.
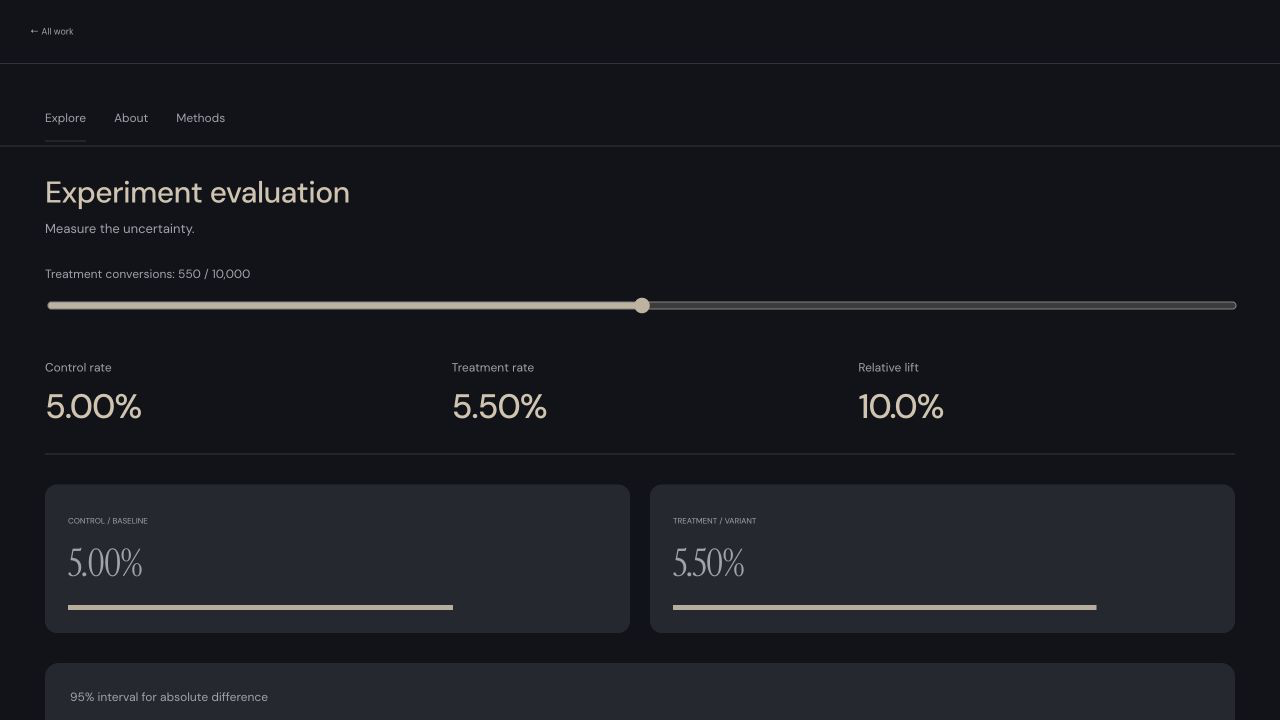
Is the difference larger than the uncertainty?
I brought conversion lift and statistical uncertainty into one view.
Put the observed result alongside the range of plausible outcomes.
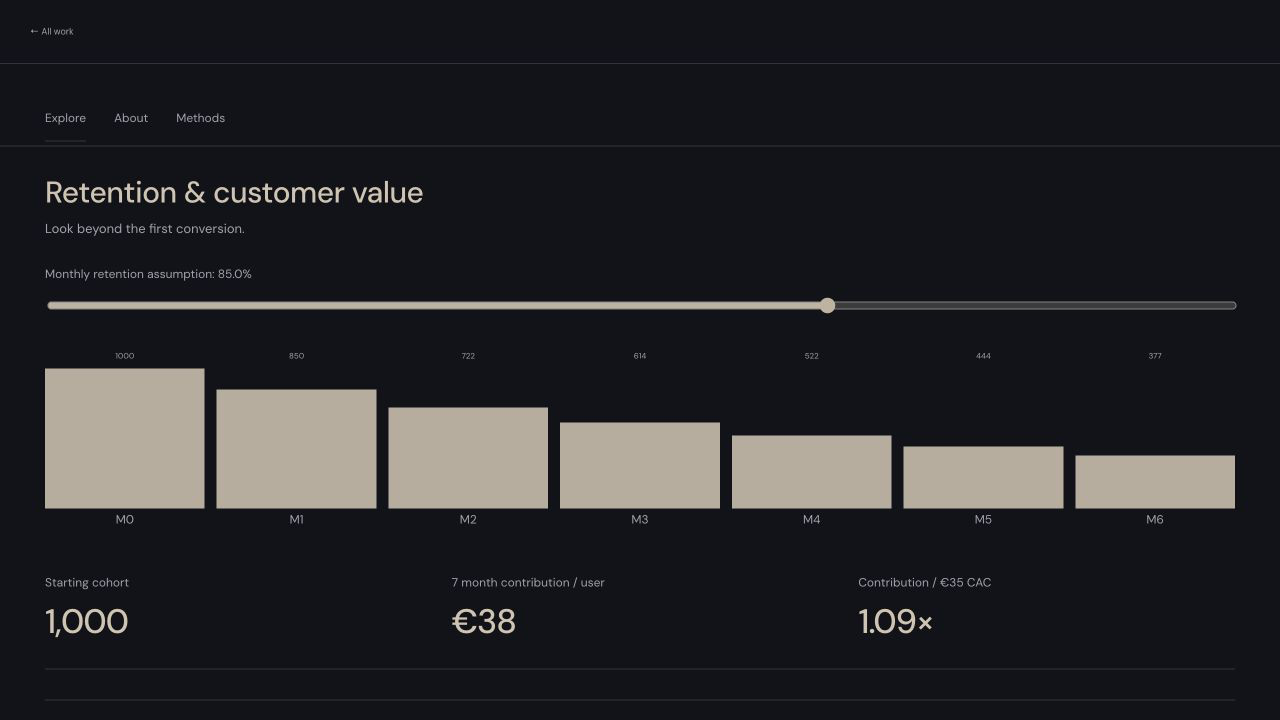
What happens after the first conversion?
I connected cohort retention with contribution and acquisition cost.
Follow cohorts through retention, contribution and customer value.
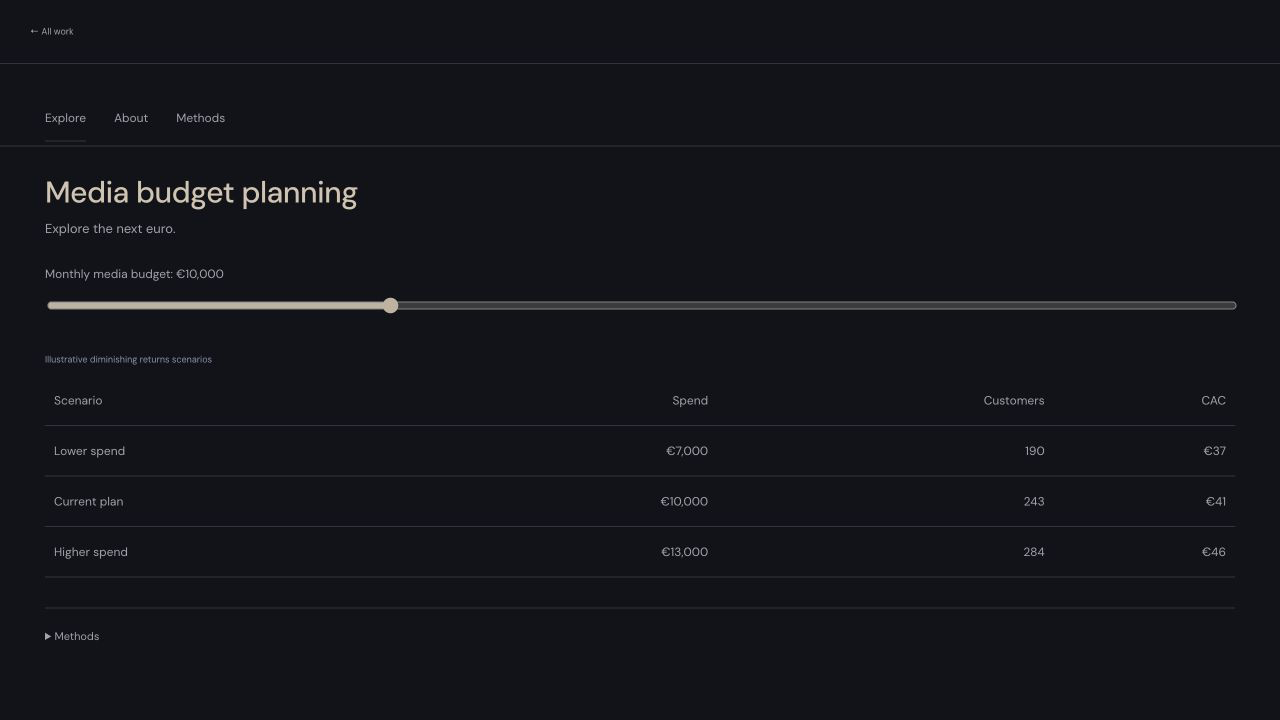
Where could the next euro work harder?
I compared spend options through a diminishing returns model.
Explore the tradeoffs when a channel reaches diminishing returns.
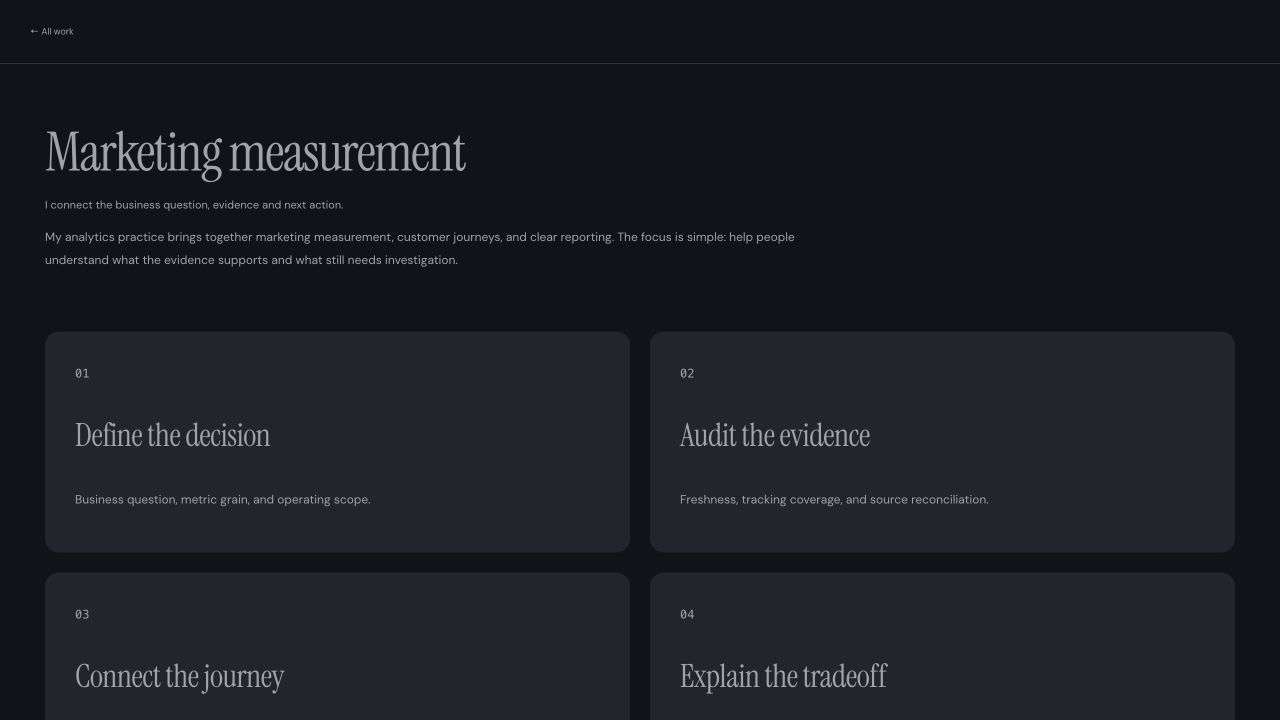
Which evidence changes the next decision?
I connect the business question, evidence and next action.
Start with the question. Make the evidence and the next action clear.
A closer look
Reporting, measurement and data quality work. Each example includes my role, approach and what I learned.
The weekly view needed to explain net subscriber growth, acquisition, cost efficiency and market level drivers together.
I built and presented the marketing readout and explained the story behind the numbers.
A repeatable weekly readout connecting the headline performance to the flows behind it.
A useful explanation starts with matching definitions and scope, rather than a chart that only shows the movement.
A recurring KPI report can change as customer cohorts mature, even when the reporting period stays the same.
I rebuilt the reporting process and validated how the recurring metrics should be compared.
A rebuilt reporting process with metric maturity considered before the figures are compared.
The extraction point and the age of a cohort are part of the comparison, not just details added afterwards.
Quarterly market reporting needs inputs that follow the same grouping rules each time.
I maintained the recurring input process from web analytics data and documented how the data was grouped.
A maintained recurring input process with the grouping logic available for review.
A reporting comparison depends on consistent grouping rules as well as consistent numbers.
Metrics need shared definitions before different reporting and measurement methods can be read together.
I wrote the framework and explained how attribution, incrementality and marketing mix modelling fit together.
A written reference linking the metrics to the measurement questions they can help answer.
Attribution credit, estimated response and evidence of incrementality should not be treated as the same result.
The measurement work needed a clear set of next questions, covering growth quality as well as immediate reporting improvements.
I proposed the measurement programme and a register of practical improvements.
A proposed roadmap covering incrementality, cohort quality, trials, offers and practical reporting improvements.
A measurement roadmap should separate the questions worth testing from the evidence already available.
Data supplied to an external modelling partner needs to be compared using matching date and maturity rules.
I am checking the supplied data and investigating the reasons for discrepancies.
The reconciliation is ongoing, with discrepancies investigated through their date, extraction and maturity definitions.
Matching a reporting date does not guarantee that two extracts represent the same point in a metric’s life.
Metric tiles and dashboard visibility need careful review so that a reporting change does not create a new interpretation or access problem.
I am working on metric tile corrections and planning the dashboard visibility changes.
The quality work is ongoing. Tile corrections and visibility changes are being treated as separate changes to review.
A safe dashboard change needs a clear definition of what is changing and who will see the result.
The question was whether traffic and acquisition changed before and during a TV campaign, and how the pattern differed by channel.
I built the comparison using SQL and GA4 data, then put the observed movements in context.
A descriptive campaign comparison showing how the observed traffic and acquisition patterns varied by period and channel.
A before and during comparison can reveal an association. It does not establish what would have happened without the campaign.
Visitors can land on a country site that differs from their recorded location. Looking at only one direction leaves part of the pattern out.
I analysed visitors landing on a different country site and explained the findings to stakeholders.
A two way view of the country site mismatch, shared with stakeholders for further investigation.
Recorded location and site choice describe different things. A mismatch alone does not explain a visitor’s intent.
The proposed audit needs a reliable completed purchase path before comparing completed and abandoned journeys.
I scoped the GA4 analysis and the evidence needed for the journey comparison.
A defined audit scope for comparing journey evidence by device. The journey findings still require execution and validation.
The absence of a purchase does not prove abandonment. The comparison needs evidence of an attempt and an explicit definition.
Behind the work
Noah Gomaa
Stockholm, Sweden
I’m Noah Gomaa, a Global Marketing Analytics Lead based in Stockholm. My work brings together marketing measurement, data analysis and data engineering.
I work across acquisition, retention, customer lifetime value and reporting. I build the analysis, check the underlying data and explain what the results do and do not support.
The experience behind the workApproach
I focus on real, sustainable growth. Clicks and platform reported numbers are signals, not the final measure of success.
I look at acquisition, retention and customer lifetime value together. The quality of growth matters as much as its size.
I describe association as association. A pattern in the data is a reason to investigate, not proof of a causal effect.
I confirm the population, time window and calculation before comparing a metric.
I state what is observed, what is inferred and what still needs a test.
I check date keys, extraction timing and cohort maturity instead of forcing different numbers to match.
Expertise
I bring together marketing measurement, statistical analysis and reliable data. The work starts with a useful question and ends with an explanation people can act on.
Chosen for the question, the data and the people using the result.
Experience
Marketing analytics, measurement and data leadership. These roles shape how I approach the work.
Marketing analytics
Marketing ROI, acquisition efficiency, advanced analytics and attribution.
Attribution and measurement
Led digital marketing analytics across channels. Built dashboards with Looker and BigQuery, and a unified data model for multi touch attribution to support budget allocation.
Data leadership
Data leadership experience spanning Adoore, Widforss and MEDs.
Analytics and data architecture
Advised clients including Samsung Nordics, Åhlens and Tikkurila on digital analytics, data architecture and dashboards. Improved reporting through automation and clearer visualisations.
Digital analytics
Digital analytics experience with Toyota and Global Connect.
Data Analyst Consultant
Data Analyst
Senior Data Analyst and Data Analyst
Customer Success Manager
Education
Bachelor’s degree, October 6 University
Selected credentials
Google Analytics Certification, Google
Front End Web Development, Beetroot Academy
Contact
For conversations about marketing measurement, analytics and data, you can reach me on LinkedIn.